What does making your health & behaviour data accessible even mean?
Jan 31, 2023
Sometime in the past month, I watched “Brain On Fire”1 on Netflix and - in true Ore fashion - found myself googling “how to be a trained neurologist?”
The main character, Susannah, experiences a rapid decline in her health within a month, and the process of finding out what is wrong with her is a difficult and uphill battle. The film highlights the importance of being able to understand and identify symptoms in order to effectively diagnose and treat neurological conditions, as well as the difficulties that can arise when symptoms are not easily visible.
I believe we are not just our “brains” though, there’s a myriad of compounding factors that lead to actions that we make daily. When a person is feeling depressed or stressed, they can feel that something is wrong, but unless ones presenting very visible symptoms - it’s hard to tell from the outside. There’s bunch of things that need to come together nicely to enable a future where there’s less guesswork in how we spend our days.
The pieces of the puzzle
1. Health Vitals
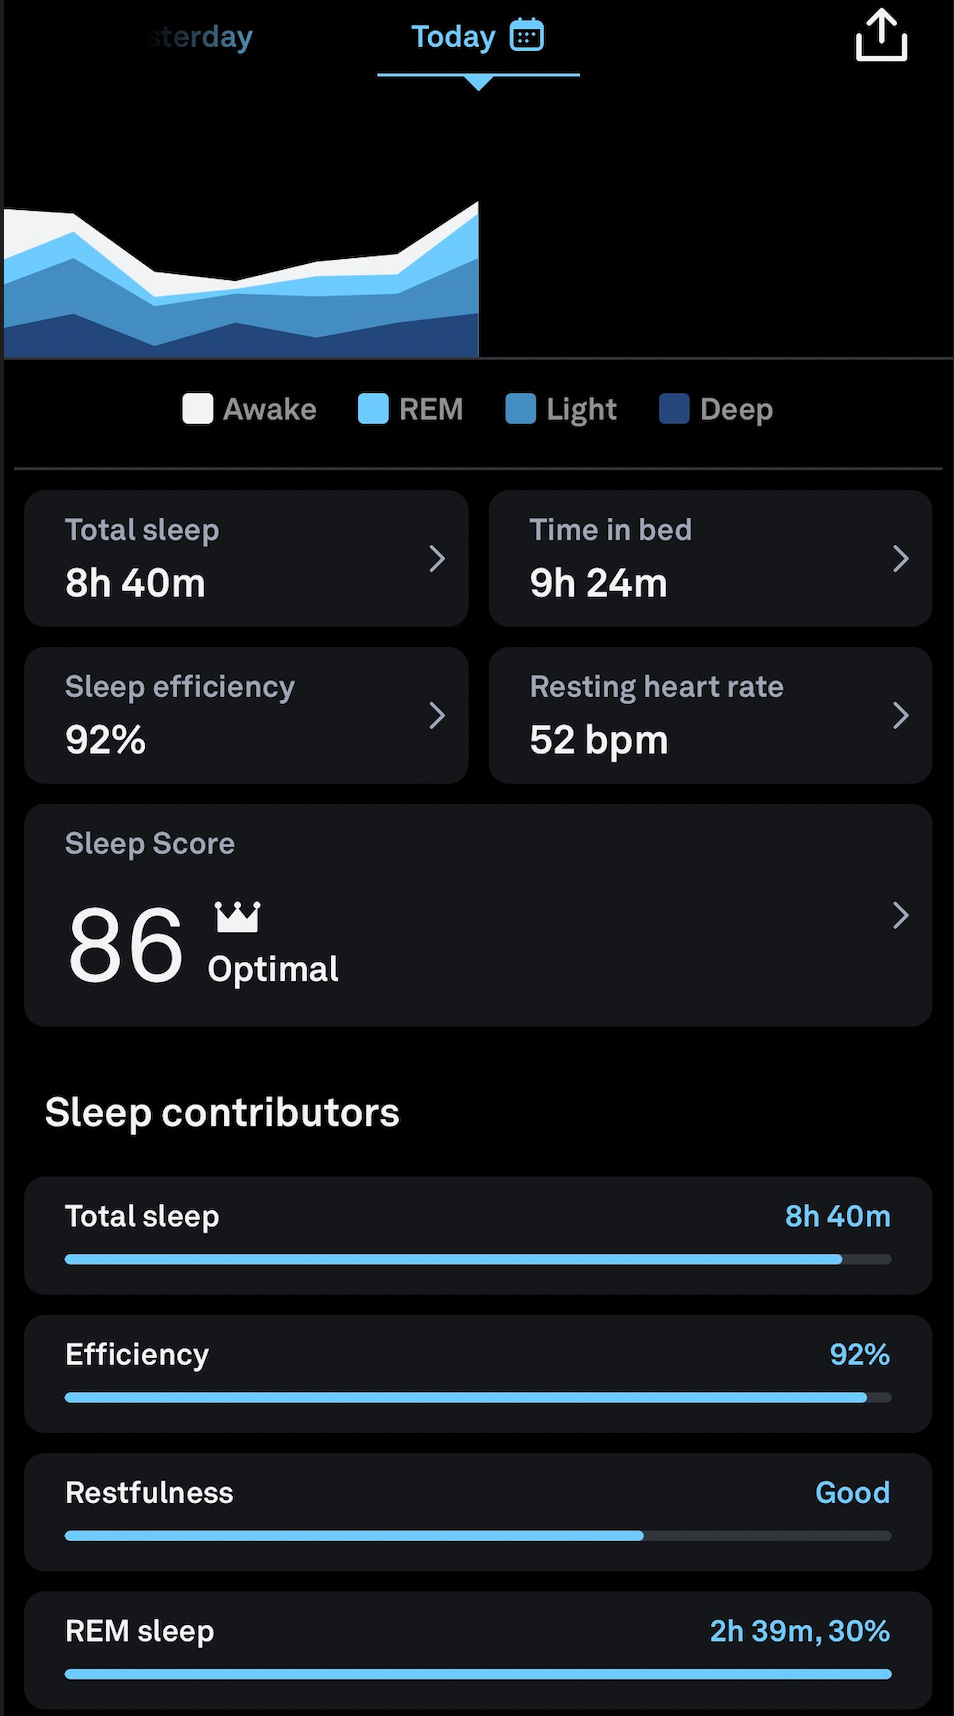
Regular check ups are recommended for the average person, but afterwards, we’re flying blind without a visit to the doctor. Thankfully, with wearables becoming mainstream, you can now record vital signals of your health. For starters, I’m focusing on metrics like:
- heart rate - number of times my heart beats in a minute
- sleep quality & what impacts it
- movements/exercise
- body temperature
- glucose levels - diabetics wear this but a non-diabetic too can wear this & understand how food consumed contributes to sugar levels in their body!
Here is paper from a recent study that shows the relationship between some of these factors.2
With my Oura, for example, I know that my sleep is critical for me to have a chance of being my best self. Once I start to slip up, I immediately try to course correct because I know it’ll help in the long run.
2. Events
In a section of “Reading our minds”3, the author attests to how feeble our memory is. You can remember clearly how you felt when you had lunch yesterday afternoon, but trying to recall how you felt doing the same thing exactly 2 weeks ago is a challenging task at best.
However, it's these small changes over time that lead to certain outcomes. Psychologists and psychiatrists have adopted these methods of self-evaluation based on different criteria, but they can be limited in their ability to capture the complexity of our emotional experiences. There are broadly two approaches to subjective measurement of emotional states individually:
-
Journalling has been proven to help with managing our emotions over time, but not many of us journal consistently - it took me about 2 years before it became a sticky habit. Even when you journal, looking back into your entries when you’re experiencing similar things isn’t a common practice - hold on to your horses though, advances in AI models are getting us much closer to this.
-
There are a plethora of mobile apps for mood tracking but seem to miss the mark because they’re either too narrow, have measures that user’s cant necessarily relate to & eventually aren’t used long enough to see results. This can be solved for though. [How? one-click response, relatable scales customized to your scenario, notification scheduling]
Imagine a future where you can look through your history when you start feeling like "something is off" and see markers explaining why this is the case. These pointers, if anything, reduce the likelihood of one thought spiralling into other things. For example, by being able to track the feelings of "hope vs. despair" over time, one could potentially identify patterns and triggers that may be contributing to their current emotional state. This level of awareness could lead to better mental health and well-being.
“How we spend our days is of course, how we spend our lives” - Annie Dillard
3. Screen time data
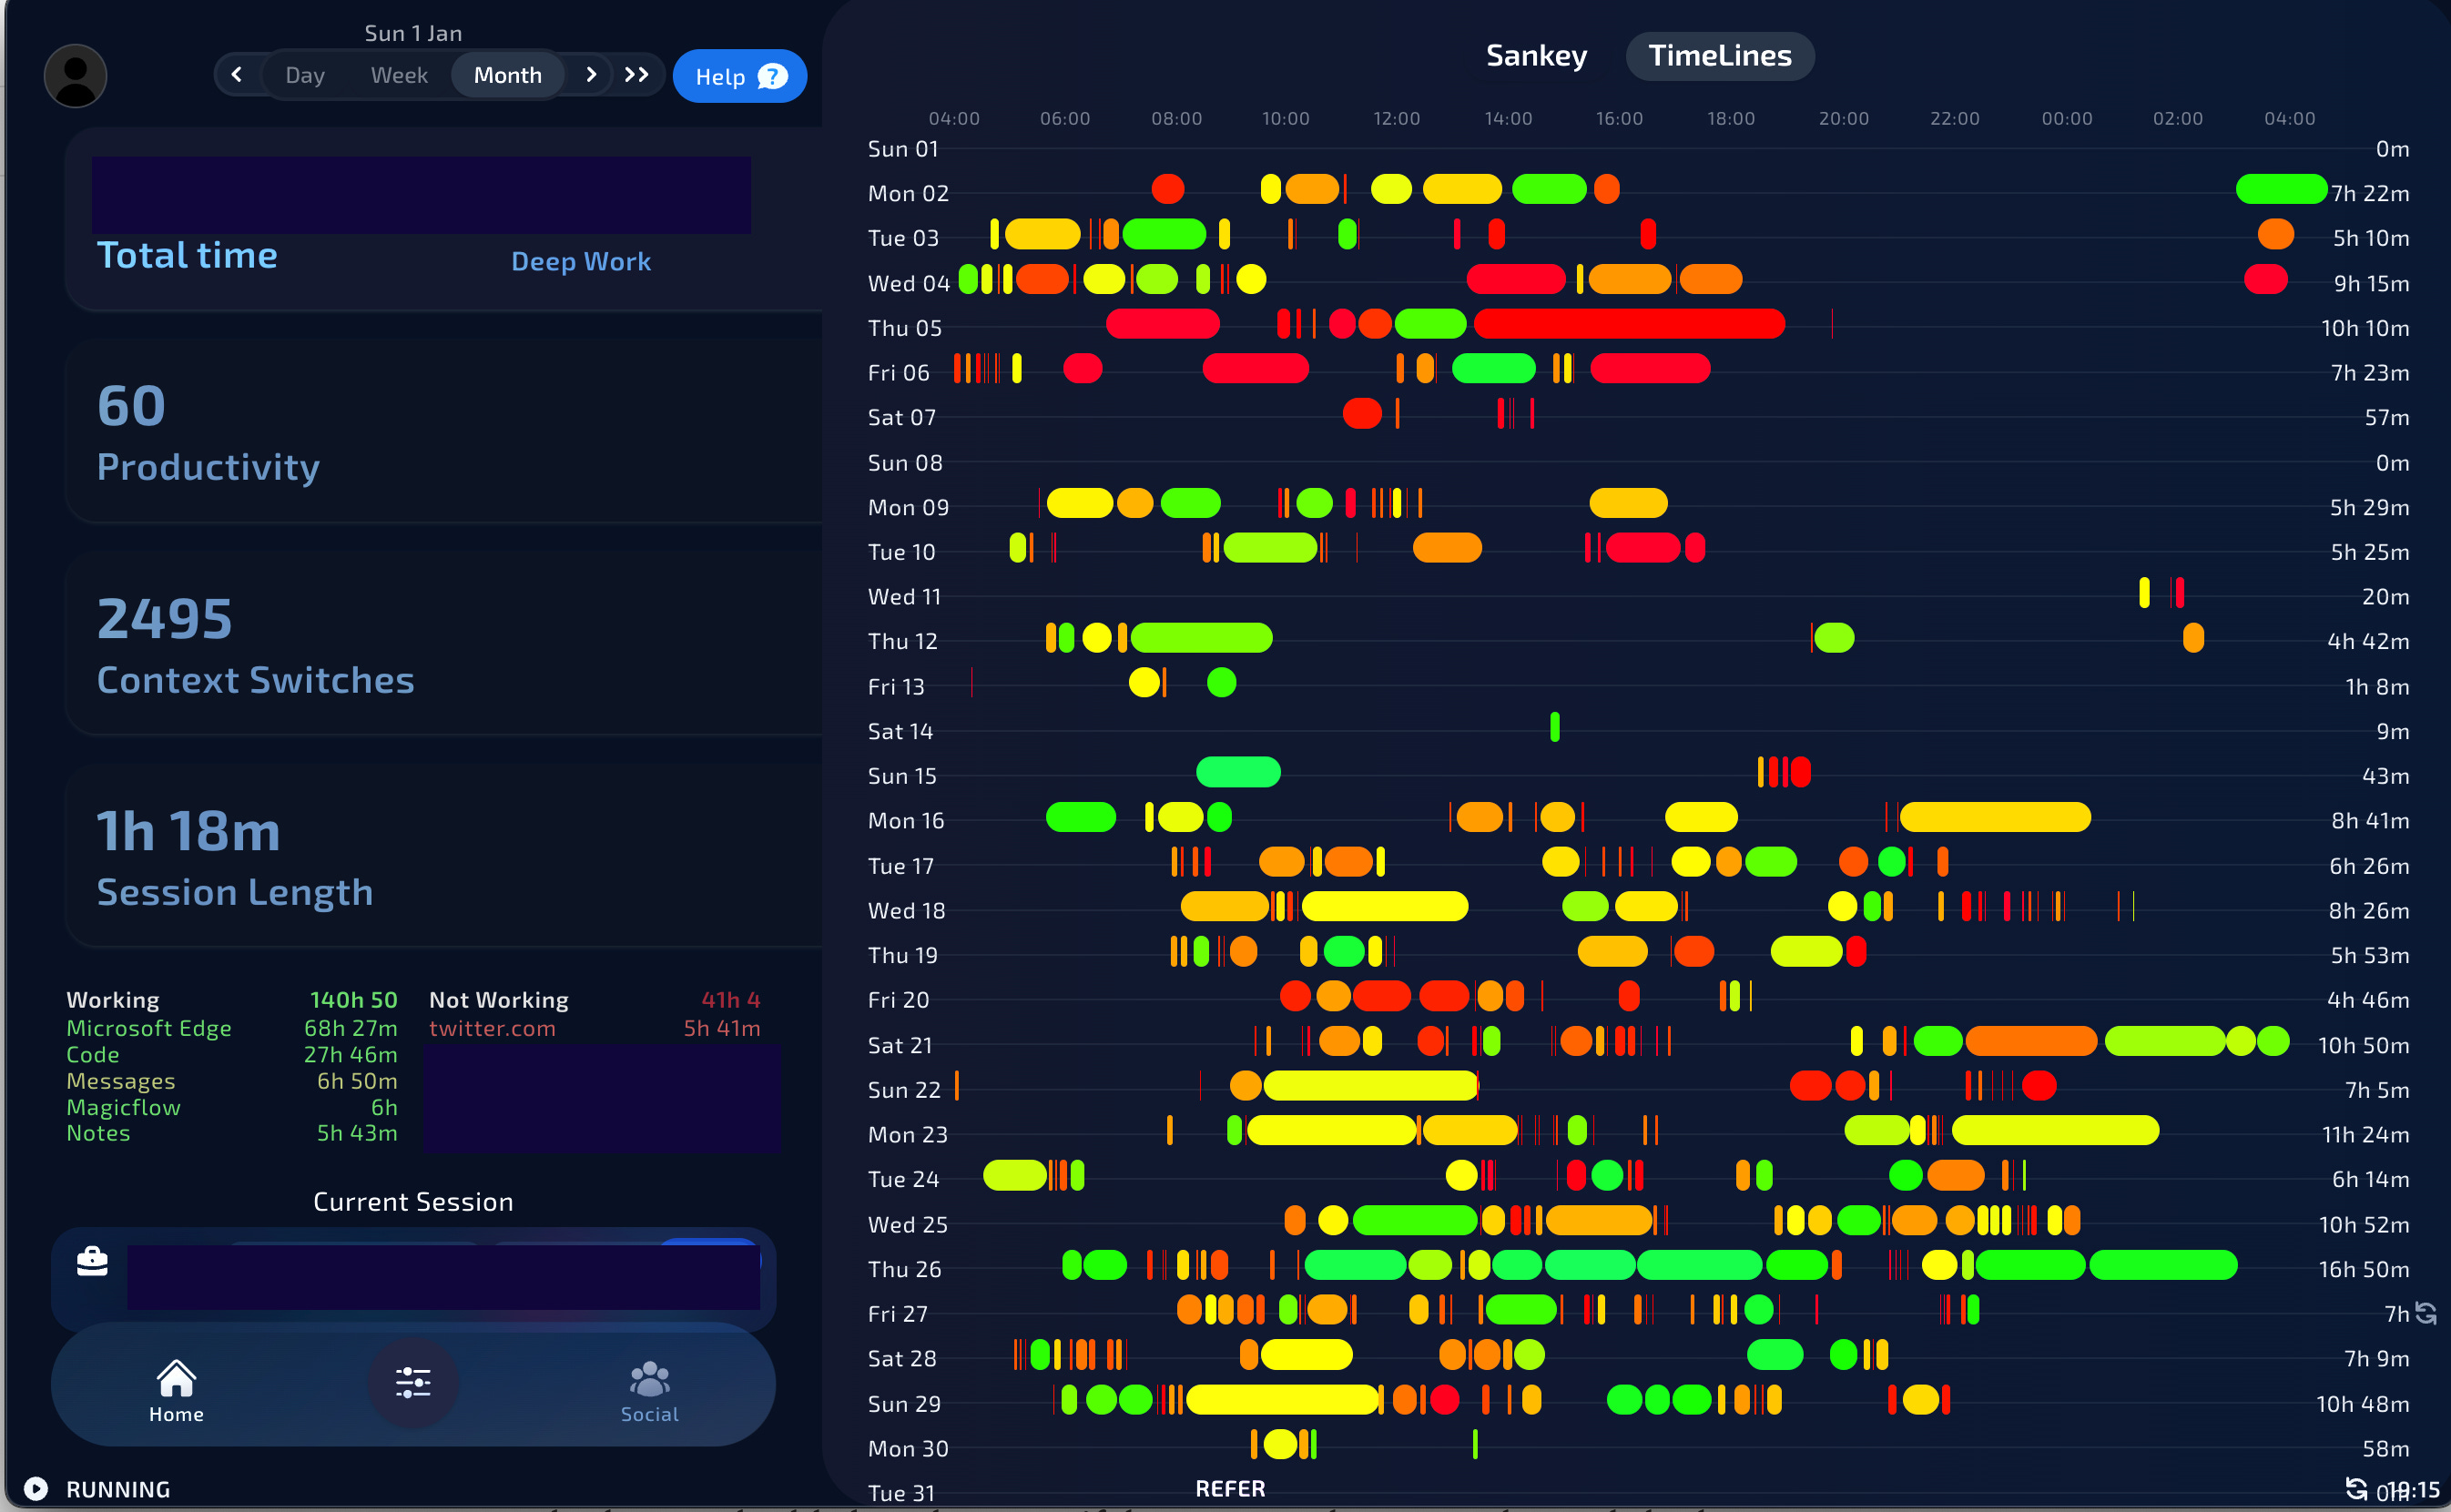
I spend a large part of my time on my computer so of course it’s a good source for understanding what my usage patterns are like. To do this I use Magicflow - p.s, it’s the best productivity coach out there :)
In the background, watcher apps like Magicflow & ActivityWatch capture what tab is currently active on the device and attaches a timestamp to when it happened. Magicflow does an impressive job to automatically categorizing your activity - which you can also update to the scenario that is important to you. So these tags can then be reviewed over time to answer the simple question of “am I doing the things I feel are important to me?”
Now that I have agency over how I spend my days, this has been a very helpful tool to help me quickly self correct, I look through the data often and then manually checkout my health data also to see if there are tweaks I can make. It also good to when it’s time to slow down - while deep work is nice, but I’m not a robot.
4. Brain Power
Neurons in your brain are constantly transmitting information - even as you’re reading this now. As this happens, an action potential is generated for every exchange (read as: electricity). By using a method called electroencephalography (EEG). We can place on the scalp to record electric activity from different regions of the brain and decompose a time period - for example 5mins of eyes closed - into the frequency waves that make it up4.
Brain wave frequency are of 5 types: Delta [1-4Hz], Theta [4-8Hz], Alpha [8-12Hz], Beta [12-25Hz], Gamma [>25Hz]5. A combination of these essentially represent the state of mind of a person in time - deducing this is where the magic is at. The thing about brain data - at least EEG - is that currently, if you don’t tag what you’re recording there’s nothing to compare it with, reducing it’s value.
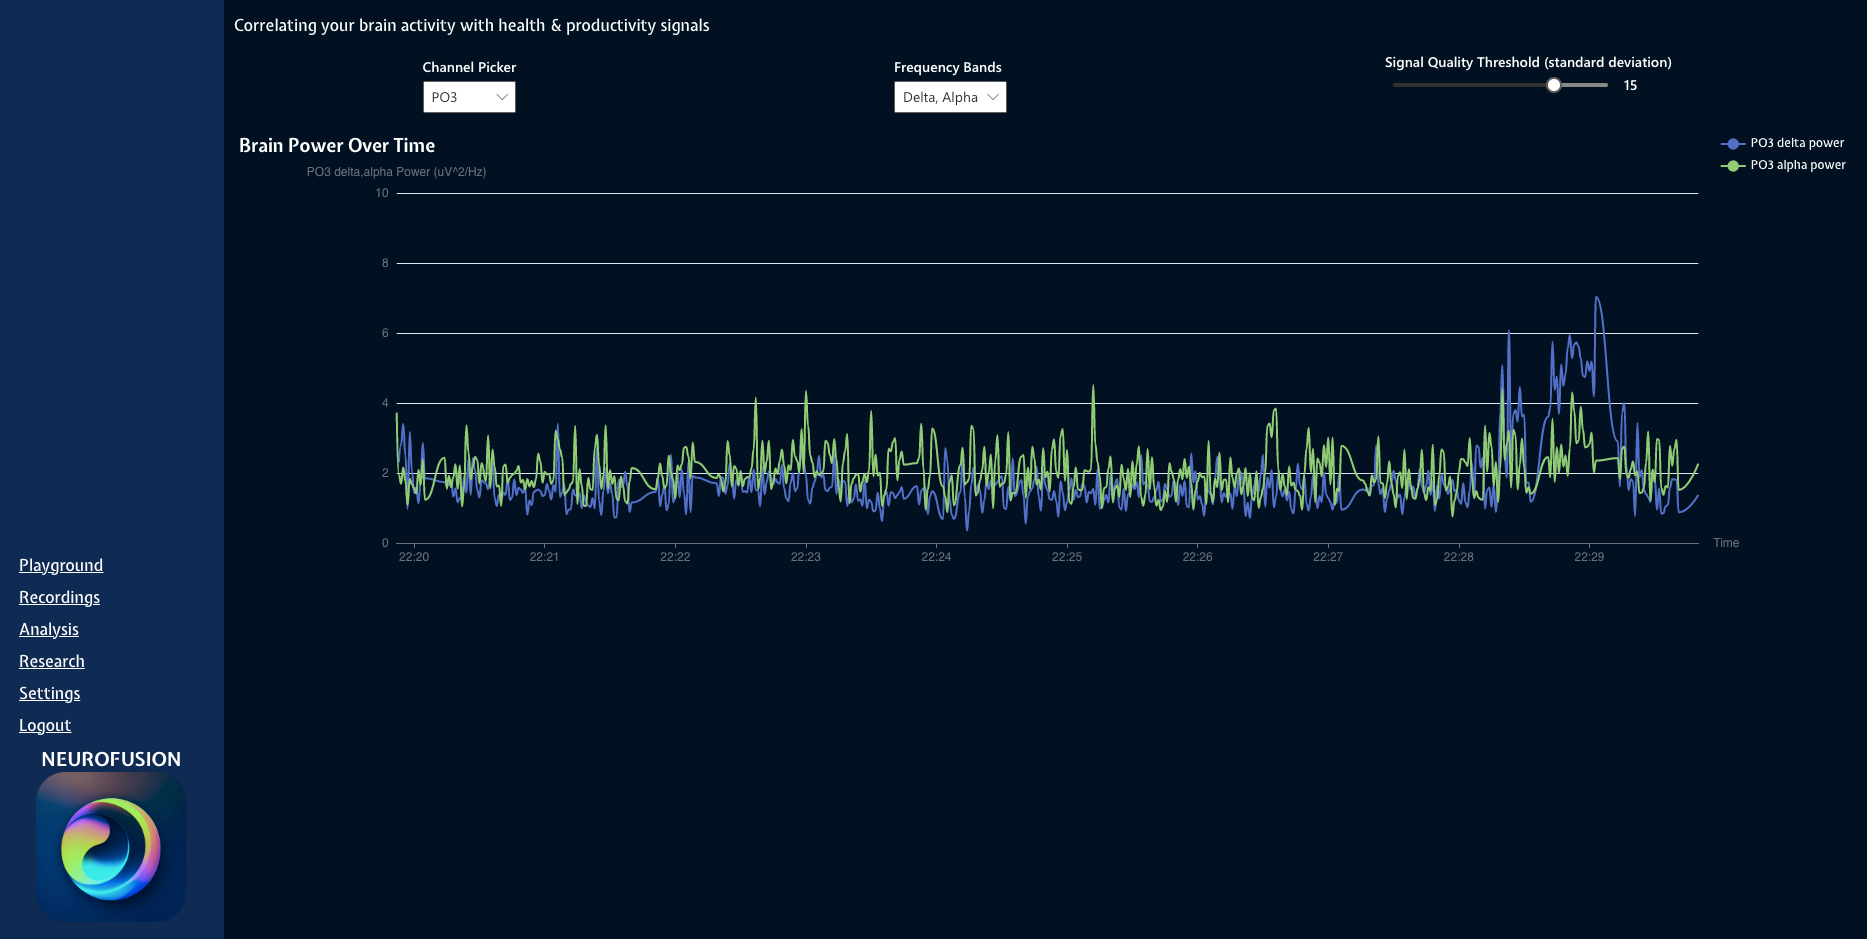
Now, there’s a lot of hypothesis about what the ratio in changes between the brain frequency bands mean, but often times, when I’ve taken my recorded data to people with expertise and asked questions about the frequency band changes the conversation usually goes like this.
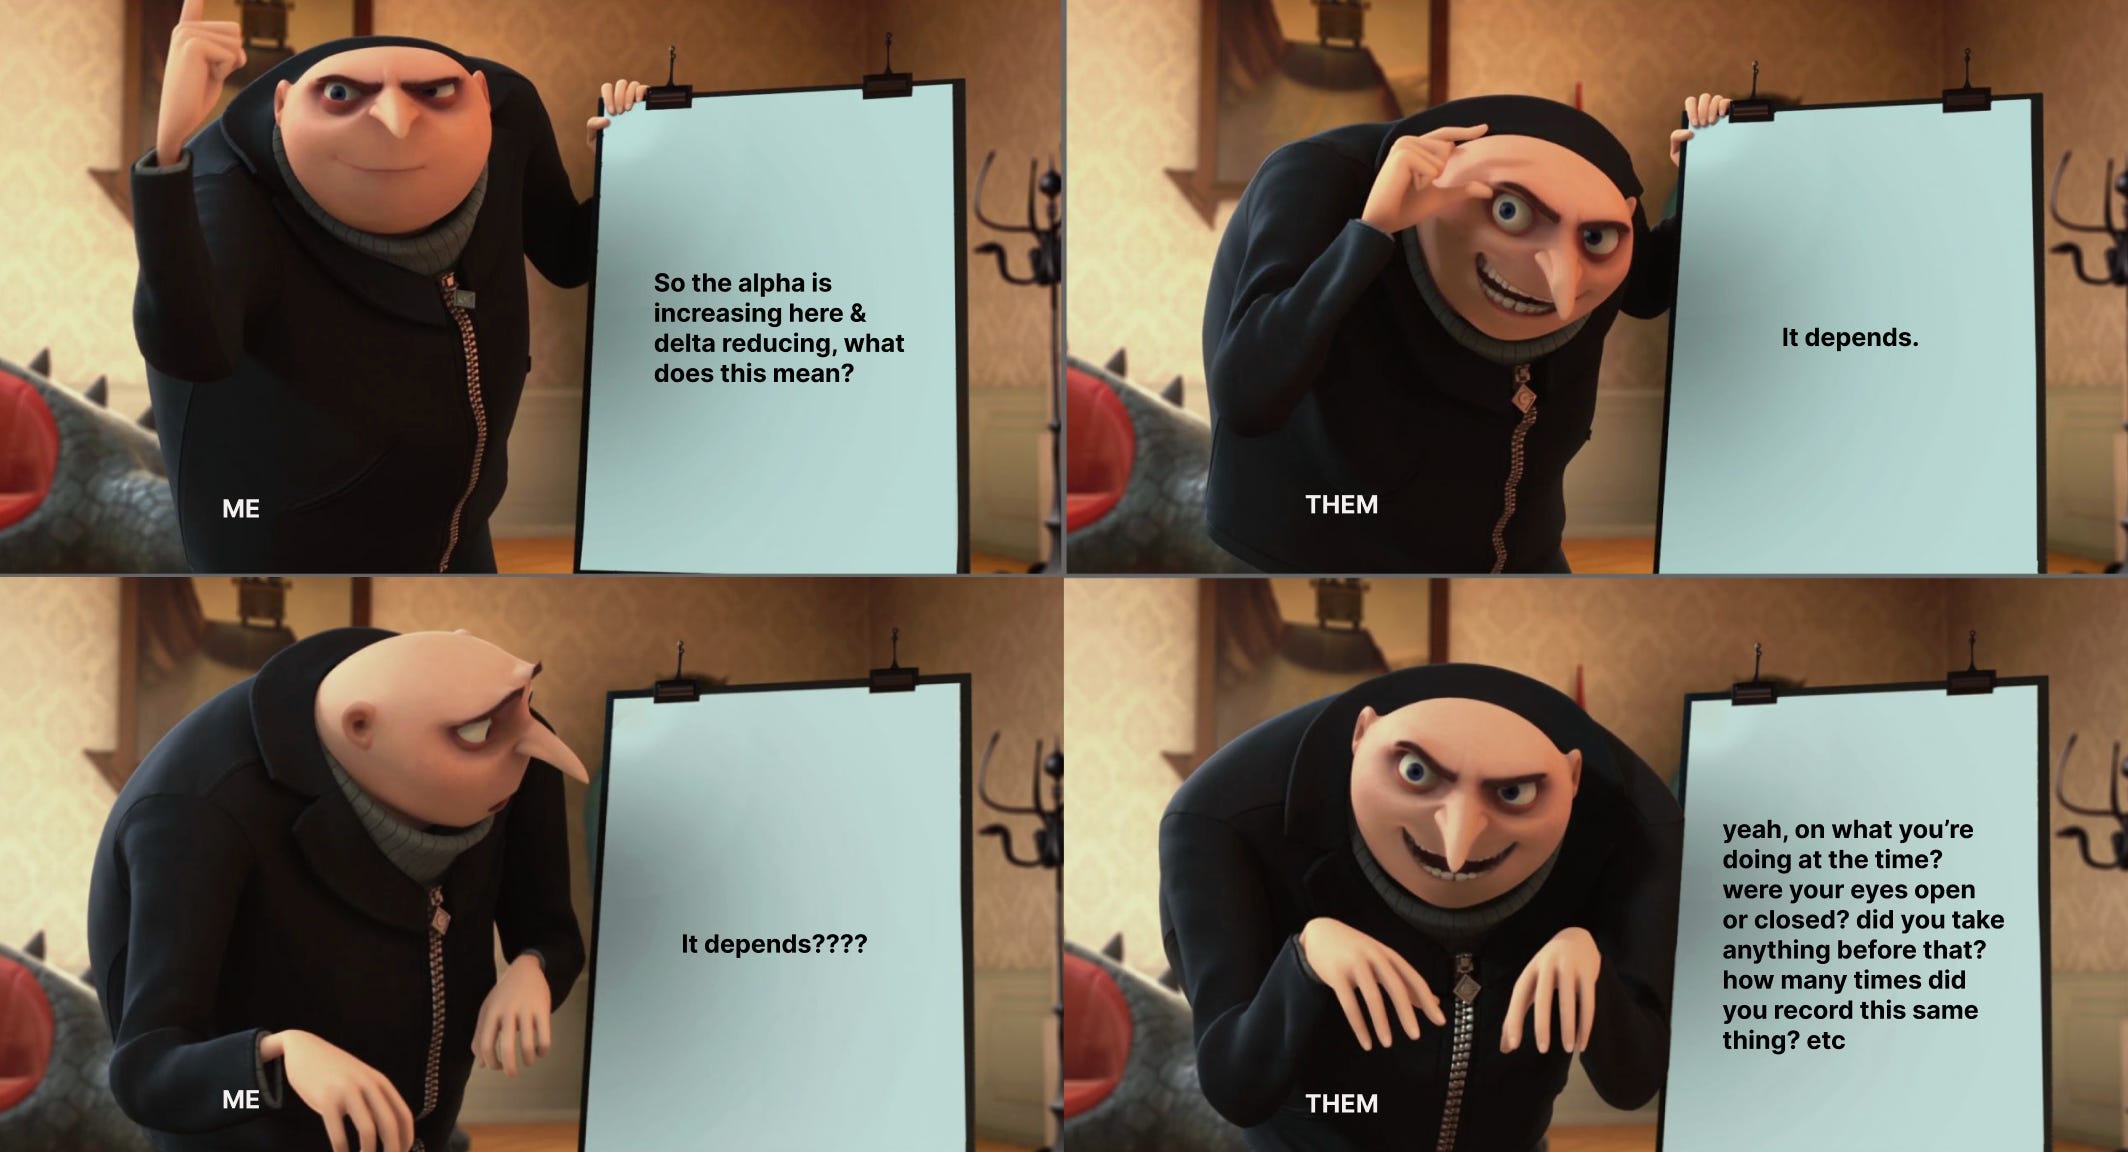
First of all, credit to them for not lying to me, but I was also disappointed. Overcoming that, I've since tweaked my approach to recording brain activity over multiple days with sufficient tagging. So far the results from my data have been quite interesting (to me) - but that could also be because I’m eternally optimistic. I don’t have any concrete insights to share here (yet), but best believe, you’d be the first to know once I do!
I’ve also found a study exploring the EEG power profiles of twins as a marker as a biomarker of wellbeing6. In the study, researchers picked a sample of twins, recorded their resting state - eyes closed - EEG and also had them fill out surveys on their subject measures of wellbeing. With some analysis, they were able to place participants into high, moderate & low wellbeing groups based on a combination of their Alpha, Beta & Delta power.
Bringing the pieces all together
Each of the sources I mentioned earlier give you a piece of the puzzle on “what’s happening with me” - but putting them all together & paint an objective picture of your days requires some finesse.
Apart from the obvious task of building a workflow to fetch this data from different providers, here are some of other critical pieces for bringing this to life
1. Interactive Insights
There has to be a balance between interest & effort required for a person using this. It has to be fun & for every data source integrated you'd want to something that keeps you feeling like it’s worth it.
My data friends have pronounced dashboard dead for a while now, but everyone’s still using it. This is not to say that I don’t agree with the argument but, I posit that the argument exists because because a lot of dashboard creators assume that anyone looking has enough context to interpret which is often false. A guiding principle around the insights display is to engage the reader through the process of discovery - which is what I aim to enable.
There’s still the “so what?” question. “Yes, I’ve seen the data and these charts are cool but what do I do with it?” - still nibbling on the answer to this one but it’s something to do with you explaining what outcomes you desire and seeing insights related to that.
2. Enabling experimentation
Trying to find the “one thing” to solve a problem like this is a fools errand. So rather than building a one size fits all platform, my goal is to build a platform that is extensible to support varying themes around the problem space.
For example, if a person wanted to examine the impact of meetings on their days, they could define the criteria for recordings, set up a workflow of experiments to run and then share on the platform for other people interested in participating. Participation here, doesn’t just mean record & submit your data but also seeing live results & being able to run your data against available analysis/models.
This adds a community style approach to questions about our behaviour, their impact and potential changes we can make to our lifestyle.
3. Form factor
Monitoring devices take a certain shape and this dictates what data points can be collected & for how long. Oura has gotten it perfectly, I forget I have the ring on and don’t have to worry about the quality of signal. EEG on the other hand is quite tricky. Things have come a long way from where we were just 5 years ago, but until my mom feels comfortable wearing it over periods of time & can get value from the data, we’re not there yet.
This however, doesn’t mean that all hope is lost, I’m confident that things will take shape over time & building an open platform which is extensible is the best approach long term.
4. Data Ownership
As you’ve probably already picked up, this is a lot of sensitive information about you. We’re already at a time where the model of the internet is set up to capitalize on your data and serve you ads. There are companies with great values who go through great lengths to assure that your data privacy & usage ethical but it’s on a “trust me, bro” basis.
Can we do better than this? - I think so. I’ll likely deep dive in another entry but for now, the long story short is that I’d be leveraging the 4th "Nostr Implementation Possibility" aka. NIP047 for data transfer that ensure encryption from source to data storage and a single key pair which can be changed over time.
veryyyyy tempted to use this for data transfer on neurofusion - no worrying about who has access/can see your data
— Ọrẹ Ògúndípẹ̀ 🧠 (@OgundipeOre) January 28, 2023
you package data & only someone with shared key can unpackage it https://t.co/E8FF6fIqhV
Authenticity of pursuit
Everyday I wake up and get to push the bounds of my understanding here is a privilege that I don’t take for granted
Time really does go by fast! It’s already been a month being fully invested in this. I’m much clearer about what parts of this effort gets tagged as research & what parts can be a product other people can use.
You know sometimes, there is this feeling that you have to go “build a thing” to get to the “actual thing you’re trying to build” and I’ve felt that feeling a lot. I’ve also felt sometimes that I’m lying to myself but that’s all normal - a healthy amount of doubt allows me to keep digging for the core.
-
Joining the Pioneer competition has allowed me to stay accountable on the “product side” of things - as I have to post weekly updates and other founders provide feedback.
-
My community members at The Nowhere Lab have also kept me very honest on the “research” side of things. Latest feedback I’ve gotten was to be more narrow on what frequency bands & relationships I’m looking for. I attempt to do just that!
-
Through February, I’ll be participating in the Research Equals pilot cohort to help me with structuring my research & approach to sharing as I go on the journey.
Finally, I want to say thank you to everyone who’s taken time out of their schedule to talk with me about this, give feedback & help keep my flames burning. I can’t give a complete list but you know yourselves. You help make this journey more exciting :)
Until next time,
Ore!
Extras
- This is where I do the ethical disclosure that I’m an angel investor in Magicflow.
- Props to M.J for the new logo!
- I can’t recommend Elicit enough - It’s a really good resource if you’re new to a topic and looking for high quality research relevant to it.
- On Saturday, I fell asleep to this entry on Differential Neurotechnology Development. It’s the most detailed for anyone interested in understanding the direction neurotechnology is going, how it’ll shape our future and potential risks!
- Brain on Fire (film) - Wikipedia
- How people wake up is associated with previous night’s sleep together with physical activity and food intake | Nature Communications
- Reading Our Minds: The Rise of Big Data Psychiatry - Daniel Barron - Google Books
- A Primer on EEG Spectrograms - PMC (nih.gov)
- EEG (Electroencephalography): The Complete Pocket Guide - iMotions
- Ore’s notes on the paper - EEG Profiles as a biomarker of wellbeing, a twin study
- nips/04.md at master · nostr-protocol/nips (github.com)
By Ore Ogundipe